
Watch Mad God
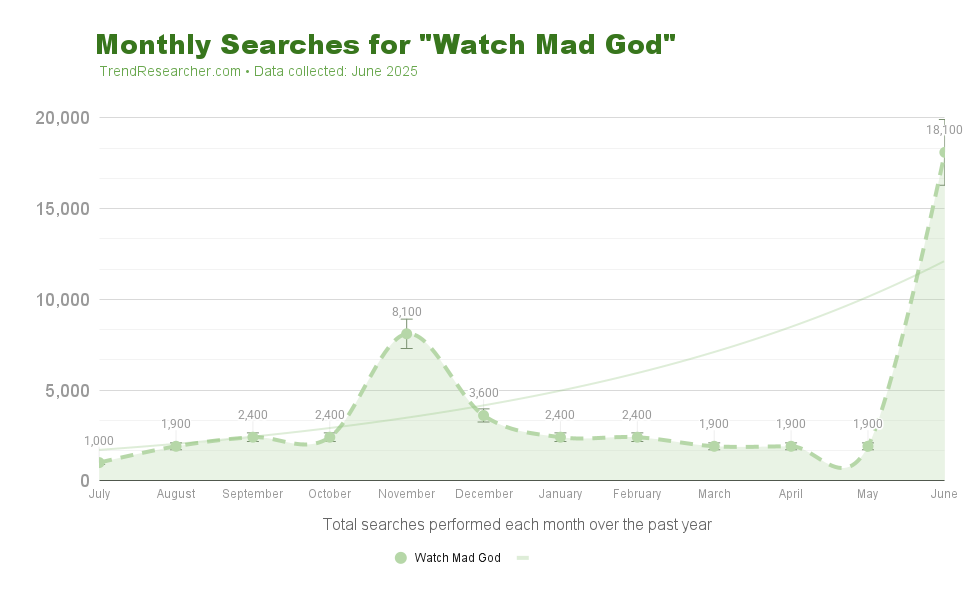
Keyword Stats
Trend Score: 9.57
Monthly: 18,100
12 months: 48,000
Growth: 1,710%
Volume Change: + 17,100
Ad Competition: 0.01
Cost Per Click: $2.25
- Overview
- Opportunites
- 10 Year Graph
- Related
Overview
Watch Mad God
“Watch Mad God” refers to the interest in “Mad God”, a 2021 stop-motion animated horror film directed by Phil Tippett, known for his work on Star Wars and Jurassic Park.
The film features a nightmarish world filled with tortured souls and grotesque creatures, all meticulously crafted through traditional stop-motion animation techniques. The story follows an assassin navigating this dark, surreal underworld.
The recent spike in searches for “Watch Mad God” is likely due to its availability on multiple streaming platforms, including AMC+, Amazon Video, Philo, Shudder, Apple TV, and others, making it easier for audiences to access and watch online.
Summary:
- What it is: A critically acclaimed, visually striking stop-motion animated horror film from 2021.
- Why trending: Increased accessibility on popular streaming services and growing audience interest in unique horror animation.
Opportunities
Business Opportunites
Online Business Opportunities Related to “Watch Mad God”
Here are some digital product ideas you could create and sell online:
- Digital art tutorials focusing on stop-motion animation techniques inspired by the film
- Horror film analysis guides that include Mad God alongside other cult horror films
- Themed digital asset packs for graphic designers (textures, brushes, 3D models with dark/dystopian aesthetics)
- Online course on practical special effects and miniature creation inspired by Phil Tippett’s work
- Downloadable companion guide explaining the symbolism and hidden meanings in Mad God
- Horror screenplay templates with analysis of Mad God’s storytelling structure
- Curated streaming guides for fans of experimental horror and animation
These products target the intersection of horror fans, animation enthusiasts, and aspiring filmmakers searching for this content.
10 Year Graph
10 Year Trend Interest Graph
Note: This Google interest graph is different from a keyword volume graph. It measures the overall interest in the keyword over the past decade, not the actual volume of searches. The peak will always be 100.
For the amount of searches being performed each month, see the green graph above.
Related
Related Topics
Note: These suggestions are automatically generated by Google and sometimes have little or no relationship to the actual search intent.

