
Kandi Ideas
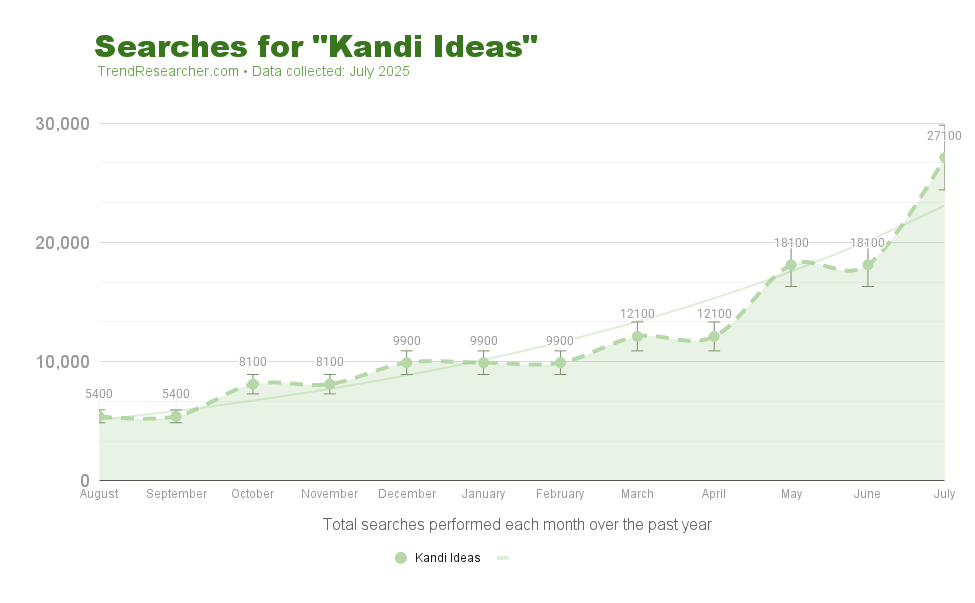
Keyword Stats
Trend Score: 21.45
Monthly: 27,100
12 months: 144,200
Growth: 402%
Volume Change: + 21,700
Ad Competition: 0.07
Cost Per Click: $0.28
- Overview
- Opportunites
- 10 Year Graph
- Related
Overview
Kandi Ideas
Kandi Ideas are trending due to their popularity in the rave culture. Kandi refers to colorful, often handmade bead accessories like bracelets, necklaces, and anklets, which are exchanged among ravers to symbolize the PLUR philosophy: Peace, Love, Unity, and Respect. These items serve as a means of connection and expression within the community. The recent surge in interest could be attributed to upcoming festivals and events where Kandi is traditionally exchanged, leading more people to search for creative ideas and designs.
Opportunities
Business Opportunites
Online Business Opportunities for Kandi Trend
- Digital Kandi Pattern Shop – Sell downloadable patterns and tutorials for making unique kandi bracelets
- Kandi Design App – Create a mobile app where users can design their own kandi patterns before making them
- Printable Festival Preparation Guides – Digital guides that include kandi ideas alongside other festival essentials
- Virtual Kandi-Making Workshops – Sell access to pre-recorded or live online classes teaching advanced techniques
- PLUR-Themed Digital Stickers – Design packs for social media, messaging apps, and digital journaling
- Kandi Trading Card NFTs – Digital collectibles representing unique kandi designs
- Rave Memory Journal Templates – Digital templates for documenting festival experiences and kandi trades
- Festival Countdown Social Media Templates – Graphics featuring kandi themes for promoting upcoming events
These digital products require minimal overhead and can be sold repeatedly without additional production costs, making them ideal for capitalizing on the kandi trend.
10 Year Graph
10 Year Trend Interest Graph
Note: This Google interest graph is different from a keyword volume graph. It measures the overall interest in the keyword over the past decade, not the actual volume of searches. The peak will always be 100.
For the amount of searches being performed each month, see the green graph above.
Related
Related Topics
Note: These suggestions are automatically generated by Google and sometimes have little or no relationship to the actual search intent.

