
Dead Cat Bounce
Keyword Stats
Trend Score: 12.58
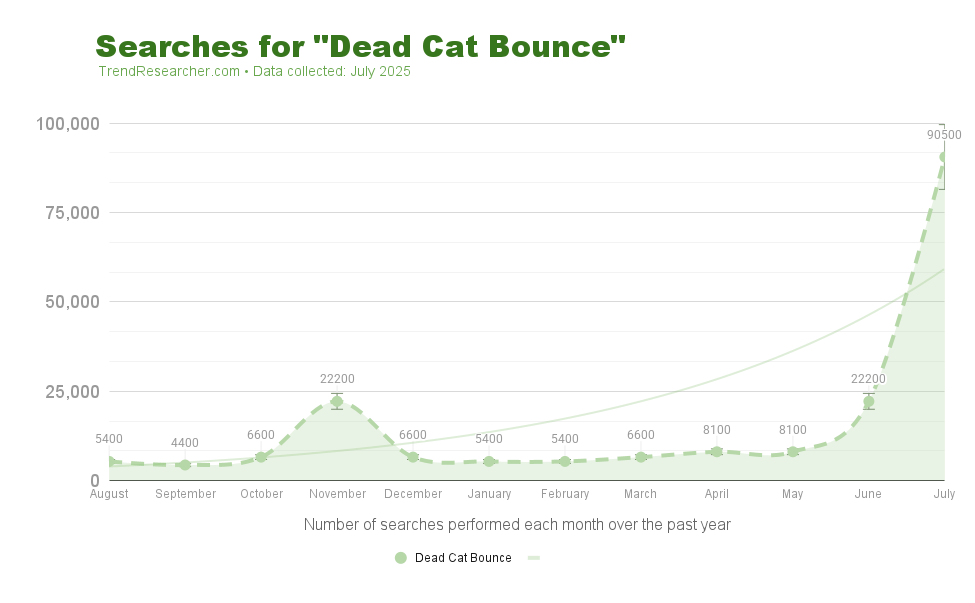
Monthly: 90,500
12 months: 191,500
Growth: 1,576%
Volume Change: + 85,100
Ad Competition: 0
Cost Per Click: $0.26
- Overview
- Opportunites
- 10 Year Graph
- Related
Overview
Dead Cat Bounce
Dead Cat Bounce is a financial term referring to a temporary, short-lived recovery or rally in the price of a declining asset, which is soon followed by a continuation of the downward trend.
The name comes from the saying that “even a dead cat will bounce if it falls from a great height,” meaning this brief rebound is not a true recovery but a short interruption in a longer decline or bear market.
- It is often called a “sucker’s rally” because it can mislead investors into thinking the downtrend is over.
- The bounce is usually unsupported by fundamentals and hard to identify in real-time.
- It is considered a continuation pattern in technical analysis.
Many people are searching for “Dead Cat Bounce” now likely due to recent market volatility or notable asset price movements causing interest in understanding these short recoveries during market downturns.
In summary: It’s a brief, misleading price recovery followed by further declines, often discussed in investing or financial news during turbulent market periods.
Sources: [Investopedia], [Wikipedia], [SoFi]
Opportunities
Business Opportunites
Business Opportunities Based on “Dead Cat Bounce” Interest
- Educational products – Create an online course or ebook teaching investors how to identify and avoid false rallies
- Stock market analysis tools – Develop software that helps detect potential dead cat bounce patterns
- Financial newsletter – Start a subscription service providing alerts about possible market traps
- Trading strategy guide – Sell a digital guide on how to profit during market volatility
- Mobile app – Create an app that notifies users of potential dead cat bounce situations
- Webinar series – Host paid webinars teaching technical analysis during bear markets
- Investment psychology course – Focus on the emotional aspects of investing during downtrends
The best opportunity might be creating straightforward educational content that helps everyday investors protect themselves from making emotional decisions during market volatility.
10 Year Graph
10 Year Trend Interest Graph
Note: This Google interest graph is different from a keyword volume graph. It measures the overall interest in the keyword over the past decade, not the actual volume of searches. The peak will always be 100.
For the amount of searches being performed each month, see the green graph above.
Related
Related Topics
Note: These suggestions are automatically generated by Google and sometimes have little or no relationship to the actual search intent.

